
Working out a travel budget
Before you book, see how far a day's spending money actually goes. A budget that feels tight in one country is generous in another.
The Big Mac Index data is sourced from The Economist and maintained on GitHub.
Data is provided under The Economist's terms. For commercial use, please refer to the original source.
The Big Mac Index compares what the same McDonald's burger costs around the world — and what that says about whether a currency is cheap or expensive.
Compare Big Mac prices in 60+ countries, discover how far money goes in USA, Europe, Asia and beyond. We hope The Economist's Big Mac Index (semi-annual publication), live exchange rates, and our own editorial deep-dives here can help to better understand currency valuations and purchasing power parity (PPP) globally.
Methodology | Contribute
 AnalysisNobody at McDonald's Headquarters Sets the Price of a Big Mac
 Deep-diveA Receipt from a Town of 11,000 Beats the Entire Euro Area
 Deep-diveBig Mac Index Colombia 2026: 4th Most Expensive in the WorldMethodologyBig Mac Index July 2026: What Changed in Six Months
 Deep-diveA Reader in Egypt Emailed Us. The Index Said E£125. The Menu Said E£170.
 Deep-diveThe Eurozone Big Mac Aggregate Is a Fiction: Inside a 25%+ Spread
Free to reuse under CC BY 4.0. If it ends up in a report, a slide or a post, please credit the source:
Source: bigmacindex.app, Big Mac Index (July 2026 edition), CC BY 4.0 Citing it in a paper? APA and BibTeX are on the data page.
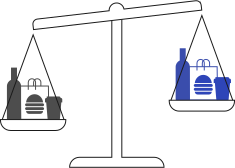
Purchasing-power parity implies that exchange rates are determined by the value of goods that currencies can buy
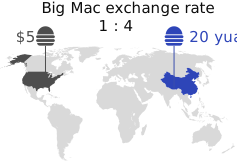
Differences in local prices – in our case, for Big Macs – can suggest what the exchange rate should be
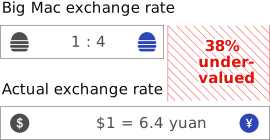
Using burgernomics, we can estimate how much one currency is under- or over-valued relative to another
Varying labour costs and barriers to migration and trade may undermine purchasing-power parity
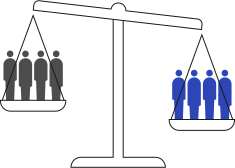
To control for this, our adjusted index predicts what Big Mac prices should be given a country's GDP per person
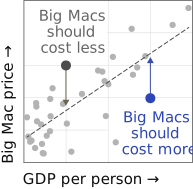
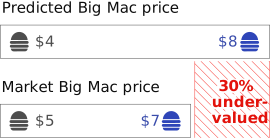
The difference between the predicted and the market price is an alternative measure of currency valuation
The Big Mac Index was invented by The Economist in 1986 as a lighthearted guide to whether currencies are at their "correct" level. It is based on the theory of purchasing-power parity (PPP), the notion that in the long run exchange rates should move towards the rate that would equalise the prices of an identical basket of goods and services (in this case, a burger) in any two countries. Our tool updates with live exchange rates, giving you the most accurate Big Mac Index data available.
Track how Big Mac prices changed over 25 years. All prices in USD.
* Prices in USD. Data from The Economist Big Mac Index (January or July each year).
| # ↕ | Country ↕ | Price (USD) ↕ | Local Price | vs Base ↕ |
|---|---|---|---|---|
| 1 | 🇨🇭 Switzerland | $9.04 | CHF7.3 | +45% |
| 2 | 🇺🇾 Uruguay | $8.94 | $359 | +44% |
| 3 | 🇳🇴 Norway | $8.05 | kr78 | +29% |
| 4 | 🇨🇴 Colombia | $8.00 | $25,900 | +29% |
| 5 | 🇮🇱 Israel | $7.67 | ₪23 | +23% |
| 6 | 🇬🇧 Britain | $7.40 | £5.49 | +19% |
| 7 | 🇫🇷 France | $7.37 | €6.35 | +18% |
| 8 | 🇩🇪 Germany | $7.31 | €6.3 | +17% |
| 9 | 🇸🇪 Sweden | $7.16 | kr69 | +15% |
| 10 | 🇪🇺 Euro area | $7.08 | €6.19 | +14% |
| 11 | 🇳🇱 Netherlands | $7.08 | €6.1 | +14% |
| 12 | 🇩🇰 Denmark | $7.04 | kr46 | +13% |
| 13 | 🇨🇷 Costa Rica | $7.00 | ₡3,150 | +12% |
| 14 | 🇹🇷 Turkey | $6.91 | ₺325 | +11% |
| 15 | 🇮🇹 Italy | $6.84 | €5.9 | +10% |
| 16 | 🇲🇽 Mexico | $6.27 | $109 | +1% |
| 17 | 🇪🇸 Spain | $6.26 | €5.4 | +1% |
| 18 | 🇺🇸 United States | $6.22 | $6.22 | — (Base) |
| 19 | 🇵🇱 Poland | $6.22 | zł23.5 | -0% |
| 20 | 🇦🇺 Australia | $5.95 | $8.5 | -4% |
| 21 | 🇦🇷 Argentina | $5.91 | $8,700 | -5% |
| 22 | 🇨🇦 Canada | $5.81 | $8.17 | -7% |
| 23 | 🇸🇬 Singapore | $5.77 | S$7.45 | -7% |
| 24 | 🇨🇿 Czech Republic | $5.43 | Kč115 | -13% |
| 25 | 🇨🇱 Chile | $5.41 | $4,990 | -13% |
| 26 | 🇱🇧 Lebanon | $5.36 | L£480,000 | -14% |
| 27 | 🇭🇺 Hungary | $5.30 | Ft1,660 | -15% |
| 28 | 🇭🇳 Honduras | $5.19 | L139 | -17% |
| 29 | 🇦🇪 United Arab Emirates | $5.17 | AED19 | -17% |
| 30 | 🇳🇿 New Zealand | $5.14 | $8.8 | -17% |
| 31 | 🇳🇮 Nicaragua | $5.11 | C$187 | -18% |
| 32 | 🇸🇦 Saudi Arabia | $5.06 | SR19 | -19% |
| 33 | 🇵🇪 Peru | $4.99 | S/16.9 | -20% |
| 34 | 🇶🇦 Qatar | $4.94 | QR18 | -21% |
| 35 | 🇧🇭 Bahrain | $4.77 | BD1.8 | -23% |
| 36 | 🇧🇷 Brazil | $4.71 | R$23.9 | -24% |
| 37 | 🇲🇩 Moldova | $4.56 | L80 | -27% |
| 38 | 🇰🇼 Kuwait | $4.52 | KD1.4 | -27% |
| 39 | 🇻🇪 Venezuela | $4.51 | Bs3,267 | -28% |
| 40 | 🇬🇹 Guatemala | $4.46 | Q34 | -28% |
| 41 | 🇦🇿 Azerbaijan | $4.26 | ₼7.25 | -31% |
| 42 | 🇹🇭 Thailand | $4.02 | ฿135 | -35% |
| 43 | 🇷🇴 Romania | $4.01 | lei18.35 | -36% |
| 44 | 🇴🇲 Oman | $3.97 | OMR1.53 | -36% |
| 45 | 🇨🇳 China | $3.91 | ¥26.5 | -37% |
| 46 | 🇵🇰 Pakistan | $3.89 | Rs1,080 | -38% |
| 47 | 🇰🇷 South Korea | $3.84 | ₩5,700 | -38% |
| 48 | 🇲🇾 Malaysia | $3.57 | RM14.55 | -43% |
| 49 | 🇯🇴 Jordan | $3.53 | JD2.5 | -43% |
| 50 | 🇿🇦 South Africa | $3.49 | R56.9 | -44% |
| 51 | 🇺🇦 Ukraine | $3.34 | ₴149 | -46% |
| 52 | 🇭🇰 Hong Kong | $3.25 | HK$25.5 | -48% |
| 53 | 🇯🇵 Japan | $3.08 | ¥500 | -50% |
| 54 | 🇻🇳 Vietnam | $2.89 | ₫76,000 | -53% |
| 55 | 🇪🇬 Egypt | $2.87 | E£145 | -54% |
| 56 | 🇵🇭 Philippines | $2.74 | ₱169 | -56% |
| 57 | 🇮🇳 India | $2.45 | ₹236.25 | -61% |
| 58 | 🇹🇼 Taiwan | $2.42 | NT$78 | -61% |
| 59 | 🇮🇩 Indonesia | $2.38 | Rp43,000 | -62% |
17 countries where The Economist's Big Mac Index can't reach. Some have closest-equivalent shadow products (Vkusno i tochka in Russia, Mash Donald's in Iran). Others are pure data black holes. Each links to the full story.
| Country | Status | Shadow proxy | |
|---|---|---|---|
| 🇰🇿 Kazakhstan | Exited 2023 | ~$5.52 I'm · Double Big Burger · ₸2,690 | Read story → |
| 🇷🇺 Russia | Exited 2022 | ~$2.55 Vkusno i tochka · Big Hit · ₽200 | Read story → |
| 🇧🇾 Belarus | Exited 2022 | ~$5.94 Mak.by · Big Burger · Br16.5 | Read story → |
| 🇲🇰 North Macedonia | Exited 2013 | ~$8.33 Burger King · Whopper Menu (Skopje) · ден450 | Read story → |
| 🇮🇸 Iceland | Exited 2009 | ~$14.21 Metro · Heimsborgari · kr1,990 | Read story → |
| 🇧🇴 Bolivia | Exited 2002 | ~$5.64 Burger King · Whopper · Bs39 | Read story → |
| 🇧🇹 Bhutan | Never opened | No equivalent | Read story → |
| 🇨🇺 Cuba | Never opened | No equivalent | Read story → |
| 🇮🇷 Iran | Never opened | ~$4.46 Mash Donald's · Tehran combo (proxy) · ﷼7,493,640 | Read story → |
| 🇮🇶 Iraq | Never opened | ~$3.05 MaDonal · Big Mack (imitator) · د.ع4,000 | Read story → |
| 🇱🇾 Libya | Never opened | No equivalent | Read story → |
| 🇲🇳 Mongolia | Never opened | ~$4.19 KFC · Zinger Combo Meal · ₮15,000 | Read story → |
| 🇰🇵 North Korea | Never opened | No equivalent | Read story → |
| 🇸🇾 Syria | Never opened | No equivalent | Read story → |
| 🇹🇲 Turkmenistan | Never opened | No equivalent | Read story → |
| 🇺🇿 Uzbekistan | Never opened | No equivalent | Read story → |
| 🇾🇪 Yemen | Never opened | No equivalent | Read story → |
Yes — that is what the Live Rates toggle does. By default every dollar figure uses the exchange rate of the week The Economist ran its survey, because that is what makes all the countries comparable to each other. Turn Live Rates on and the same burger prices are converted at the current market rate instead.
The gap between the two is the useful part. Burger prices in a country barely move between editions, so most of what changes in the dollar column is the currency, not the burger. Seeing both tells you which one you are actually looking at.
Yes — all the same measure. The Big Mac Index gets shortened and reworded constantly: Mac Index, Burger Index, Hamburger Index, McDonald's Index, Big Mac scale, or just "the burger standard". They all refer to the same thing — The Economist's 1986 invention that uses the price of a single McDonald's Big Mac as a rough gauge of whether a currency is under- or overvalued against the dollar. The Economist's own name for the underlying idea is "burgernomics". Whichever name brought you here, the numbers on this page are the ones you were looking for. One wrinkle worth knowing: nine of the markets we track have no McDonald's at all, so there is literally no Big Mac to price — we use the closest local burger instead, and list every substitute brand and price on the burger index page.
Simple math, burger style. We take each country's Big Mac price in USD, subtract the US price ($6.22), then divide by $6.22. Japan's Big Mac costs $3.08, so that's (3.08 - 6.22) / 6.22 = -50.4%. Negative means cheaper, positive means pricier. This percentage is the heart of the Big Mac Index — it suggests whether a currency is under or overvalued. A -50% reading hints the yen might be 50% "too weak" against the dollar, at least by burger economics.
Absolutely — and this is something most Big Mac Index tools don't offer. Use our base currency selector to switch from USD to EUR, GBP, JPY, or CNY. Suddenly Switzerland isn't the priciest anymore when measured in Swiss francs! This feature helps European travelers see the Big Mac Index from their perspective, or lets Chinese users compare purchasing power in yuan. The math recalculates everything on the fly.
More than you'd think. When a currency is severely undervalued according to the Big Mac Index, it often correlates with cheaper labor costs, which can boost export-driven stock markets. Conversely, overvalued currencies can squeeze corporate profits. Some quant funds actually track the Big Mac Index as one input for currency-hedged equity strategies. We're adding historical charts so you can overlay Big Mac price trends with major market indices — stay tuned.
Think of the Big Mac Index as your "bang for buck" compass. If you're choosing between Thailand (-42%) and Australia (+12%), your dollars stretch further in Bangkok. But it's not just about burgers — the Big Mac Index reflects broader costs: hotels, meals, transport. Countries with cheap Big Macs usually have cheaper everything. Pro tip: check our historical trends. A currency that's dropped 20% this year means your vacation just got 20% cheaper.
McDonald's doesn't operate everywhere. No Big Mac, no Big Mac Index. Countries like Iran, North Korea, and most of Africa lack McDonald's franchises. India's data uses the Maharaja Mac (chicken-based) since beef isn't sold there. The Economist surveys 76 markets — a decent sample of the global economy, but not exhaustive. We grey out unavailable regions on the map so you know where the data gaps are.
Most sites just republish The Economist's static tables. We built something more useful: daily rate updates, multi-currency base switching, interactive maps with click-to-explore, historical trend charts back to 2000, and SEO-friendly country pages you can bookmark. Our Big Mac Index tool is designed for travelers, students, and curious minds — not just economists. Plus, everything loads fast and works beautifully on mobile. No paywalls, no clutter.
Both, honestly. The Big Mac Index started as a "lighthearted guide" in 1986, but it's been cited in hundreds of academic papers, central bank reports, and finance textbooks. Why? Because it makes purchasing power parity tangible. You don't need an economics degree to understand that a $2.50 burger in one country vs $7.99 in another reveals something real about currency values. The Big Mac Index won't replace Bloomberg terminals, but it'll make you smarter at dinner parties.
Deep dives behind the index — countries without McDonald's, eurozone disaggregation, methodology essays.
 Big Mac Price in Australia 2026: A$8.50, 4% Under the US Country deep-dive Big Mac Price in Egypt 2026: E£145 on Paper, E£170 on the Menu Country deep-dive Nobody at McDonald's Headquarters Sets the Price of a Big Mac Analysis
  Big Mac Index 2025: All 54 Countries, and What Changed Methodology
  What Four Years of War Did to Ukraine's Big Mac Analysis
  Should You Charge Less for Your App in Poorer Countries? Methodology