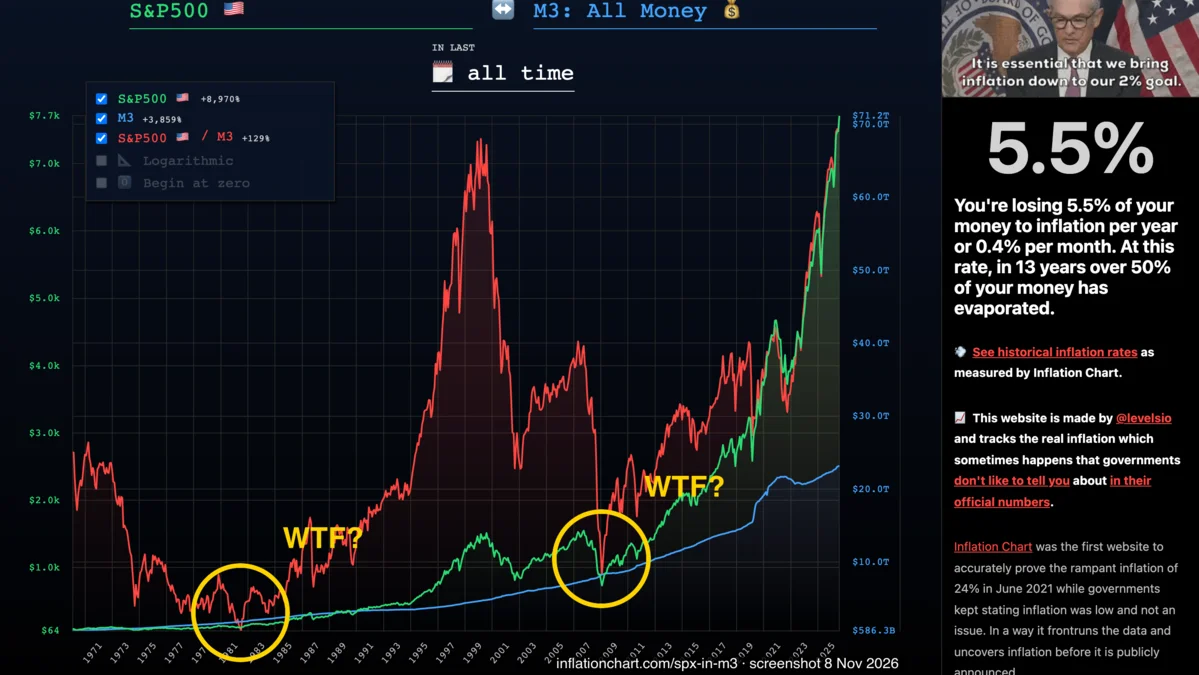
“You’re losing 5.5% of your money to inflation per year or 0.4% per month. At this rate, in 13 years over 50% of your money has evaporated.”
Meanwhile, the guy running the printer:
Why TF you write this?
-
I live in Australia, and I’m squeezed like every other middle-class person here. I already ranted about it in Shitty Inflation. I’m lactose intolerant, so lactose-free milk is just “the milk” for me. It was about $1 a carton when I arrived. It’s about $2 now.
-
I’ve read levelsio for years. I only came across this site yesterday.
wtf is this
Take all the money in America. Cash, bank deposits, the lot. Economists call that pile M3.
Careful: money, not wealth. Houses, companies, gold, that’s wealth. At the end of 2023, all the money in America (M3) was about $21 trillion. Everything American households owned, minus their debts, was about $147 trillion. Seven times bigger.
So M3 isn’t “all the stuff”. It’s the measuring stick. The question is: if you sold this thing today, what share of all the money would you walk away with?
Picture it as a pizza. And this pizza never stops getting bigger.
Two things make it bigger:
- The economy makes more stuff. More people, more goods, more deals. All of that needs more money to change hands. Fair enough.
- The Fed and the banks create money on top of that. That’s the printer.
The size of the pizza isn’t the point. The point is how much of it ends up on your plate.
Say the pizza doubles. Your piece stays the same size. You didn’t lose anything you can see. But your share of the whole thing just got cut in half.
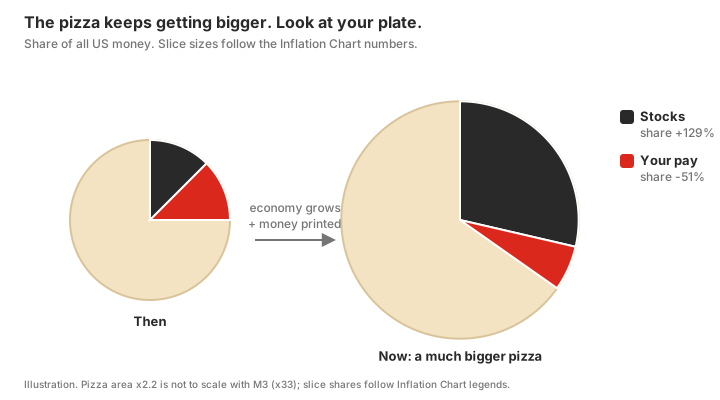
That’s the whole site. Pick a thing, a stock index, gold, a house, your pay, a Big Mac, and it asks one question: does this thing’s piece grow as fast as the pizza?
- Green line: the price in dollars.
- Blue line: the size of the pizza (M3).
- Red line: green divided by blue. Red goes up, the thing is outrunning the money printer. Red goes down, the printer is eating it.
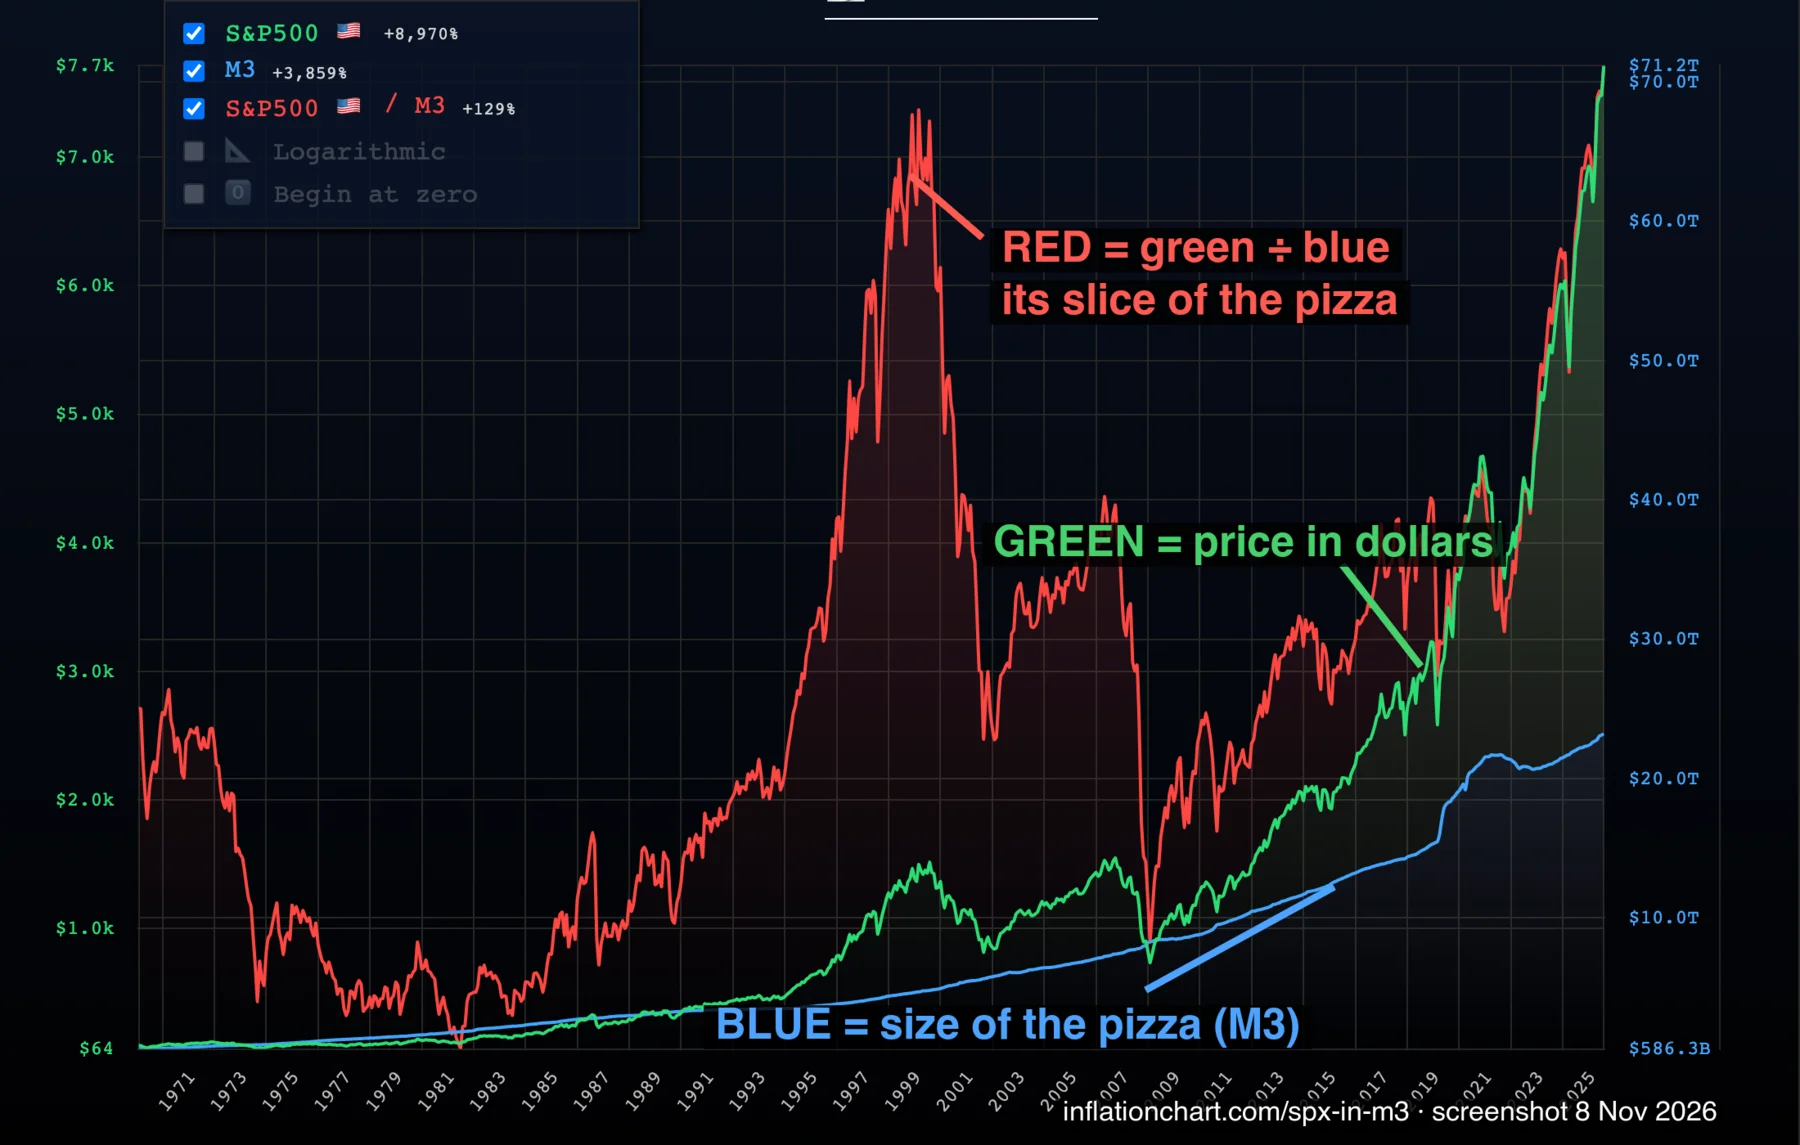
He has a dozen other things you can measure, and other yardsticks too. Go play with it.
Wait, is the red line going up good or bad? Depends what’s on your plate.
- You already own it: red going up is good. Your slice is growing faster than the pizza.
- You want to buy it: red going up means it’s getting pricier. Red at the bottom means it’s on sale.
So the holes are when it hurt to own stocks, and also when stocks were cheapest. Here’s what happened if you bought at each extreme and held for 10 years:
| Bought in | Red line was | 10 years later, after prices | Share of the pizza |
|---|---|---|---|
| Aug 1982 | at the bottom | ×2.64 | +107% |
| Aug 2000 | at the top | ×0.58 | −59% |
| Mar 2009 | at the bottom | ×3.09 | +114% |
Our calculation: monthly S&P 500 from Shiller’s data, after prices with CPI, share of the pizza against M3.
Both holes were awful to live through and the best time in 50 years to buy. The peak felt great and was the worst time to buy.
Where’s the red line now? Above the 2000 peak. Keep that in mind.
Why am I angry? Milk.
I used to buy my lactose-free milk at Aldi. $1.80 there, $2.00 at Woolworths. Twenty cents. Worth the walk.
Now Aldi is $1.99. Woolworths is still $2.00. One cent. What’s the point?
lmao. what’s even the point.
And with prices like this, who the fuck dares to have kids? Where I come from in Asia, the old saying is more kids, more blessings. Now everyone around me is getting squeezed out of having any. Fuck.
wtf I can see
I put in the S&P 500, measured in M3, all time.
The legend says: S&P 500 +8,970%. M3 +3,859%. S&P 500 divided by M3 +129%.
So if you held stocks the whole way, you beat the printer. Fine.
But the red line doesn’t just go up. It has two huge holes in it: 1982 and 2009.
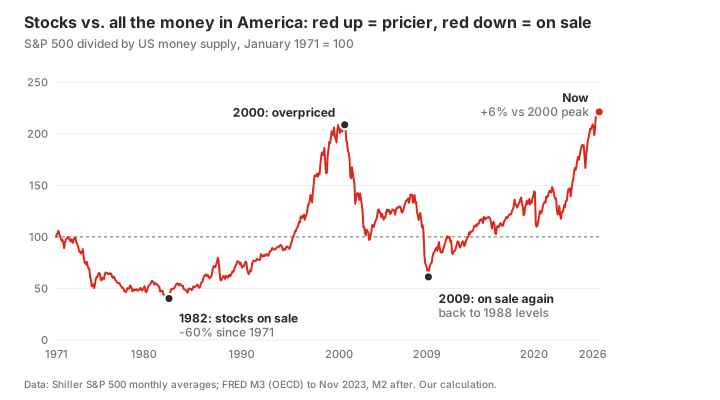
So naturally, two questions. Wtf happened in those two years? And did all the printed money just go into stonks?
wtf happened in 1982
>be regular american, 1980
>have job, bit of savings
>want house and car someday
>lol
All the money in America grew almost 10% a year through the 70s. Prices ran right behind it. By March 1980 they were going up 14.8% a year.
Here’s what that did to you, January 1971 to August 1982:
| What happened | After prices | |
|---|---|---|
| Everything you buy | ×2.45 | |
| Gas | ×2 in two years | |
| Your hourly pay | ×2.25 | −8% |
| Savings in T-bills | 16.3% a year at peak | −1% in 11 years |
Look at that last row. The government paid you 16% a year to hold its paper, and eleven years later you were slightly poorer. Kek.
Against the whole pizza, your pay lost 23% of its share. Your savings lost 17%. Stocks lost 60%. Everyone’s slice shrank. Everyone got fucked equally, which I guess is fair.
Then the Fed said enough and made money stupidly expensive. The federal funds rate hit 19.1% in June 1981.
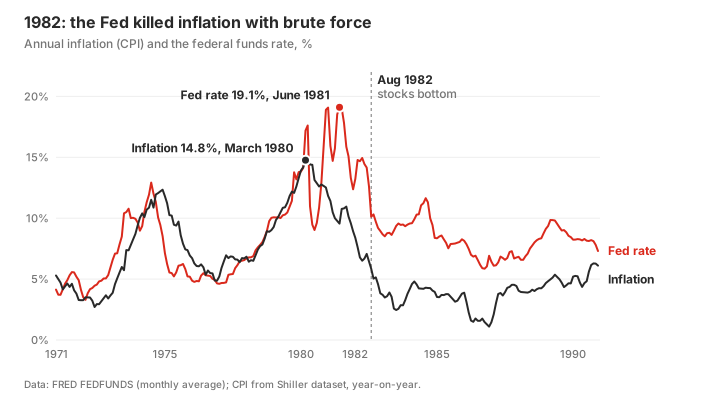
For a normal person that hurt like hell:
- A house. The 30-year mortgage rate hit 18.63% in October 1981. On a median-priced home with 20% down, that’s about $878 a month, or 116 hours of work at the average hourly wage. In early 1972 the same maths was $143, or 38 hours. Same house, but now you work 3 hours to pay what 1 hour of wages used to cover.
- A car. A four-year car loan cost 17.36% in November 1981.
- Your job. Unemployment went from 5.9% in January 1979 to 10.8% in November 1982.
And stocks? You buy government bills instead. Stocks can drop until you’re crying for daddy. Bills just pay you 15% at maturity, safe in the bag, life is good. Only idiots buy stocks. (Yeah, I know. They also said only idiots buy Bitcoin. Why wasn’t I an idiot? Sigh. The idiots won.) The Shiller P/E, the usual “how expensive is the market” number, fell to 6.6. That’s the bottom of the red line.
So was there any upside? Yeah. It just works.

Inflation fell from 14.8% to 5% by September 1982, and 2.6% by June 1983. Money growth slowed down too: 9.8% a year in the 70s, 7.1% in the 80s, 3.9% in the 90s.
And stocks were dirt cheap. The S&P 500 bottomed on 12 August 1982 at 102. Three months later it was 143. Whoever bought that slice rode an 18-year bull run. By 2000 the red line was five times higher than in 1982 (Shiller, M3).
One more group quietly won the 70s: people who had locked in a fixed mortgage early. The rate was 7.23% in 1972. Inflation ran above that in 73 of the 120 months from 1973 to 1982. Their debt shrank in real terms every year. The bank lost, they won.
House maths: US median sales price of houses sold ($26,200 in Q1 1972, $70,400 in Q4 1981), 80% loan, 30-year fixed at that week’s Freddie Mac rate, divided by average hourly earnings of production and non-supervisory workers. Our calculation.
wtf happened in 2009
The bankruptcy of Lehman Brothers fucking happened. 15 September 2008.
How did we get there? Short version: America lent people money to buy houses, bet that house prices only go up, and then house prices went down.
Be a regular American again. Here’s your 2007 to 2009:
| Before | Then | |
|---|---|---|
| Your house | peak, Jul 2006 | −27% (Feb 2012) |
| Mortgages in arrears | 1.61% (2006) | 11.48% (2010) |
| Unemployment | 4.4% (May 2007) | 10.0% (Oct 2009) |
| Gas | $4.11 (Jul 2008) | $1.61 (Dec 2008) |
| Savings interest (T-bills) | 4.98% (Jan 2007) | 0.13% (Jan 2009) |
| Stocks | 1,565 (Oct 2007) | 677 (Mar 2009) |
House prices only got back to the old peak in January 2017. Unemployment only got back under 5% in January 2016. Gas fell 61% in six months. Because the economy crashed and demand for fuel collapsed.
And the best part:
>get scared
>finally start saving like a responsible adult
>US savings rate goes from 1.4% (July 2005) to 7.8% (May 2009)
>interest on savings goes to zero the same year
>mfw
Meanwhile the pizza kept growing. M3 grew 16% while stocks halved, so the red line dropped all the way back to 1988.
The Fed’s answer was the opposite of 1982. In November 2008 it started buying mortgage bonds, the first round of what everyone now calls QE. In December it cut rates to 0–0.25%. Its balance sheet went from $0.9 trillion before the crash to $4.5 trillion by late 2014.
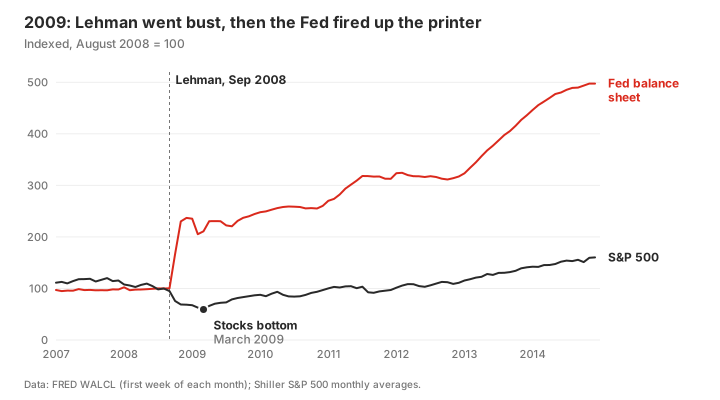
Funny thing. In 1982 the Fed paid savers 15%. In 2009 it paid them basically nothing. Same country, same Fed.
So whose slice grew after 2009? I cut the decade from the bottom, March 2009, to December 2019, right before COVID. The pizza grew 1.83 times. Then:
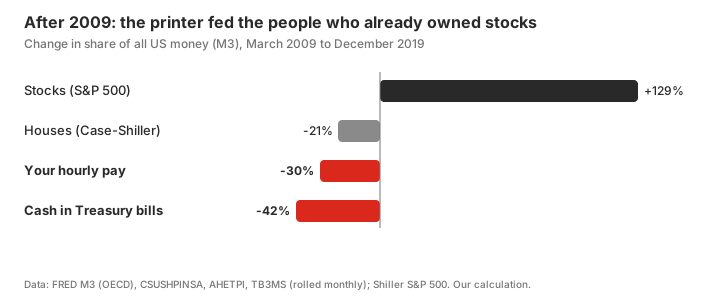
- Stocks went ×4.2. Their share of the pizza: +129%.
- Your hourly pay bought 6% more stuff after ten years. Its share of the pizza: −30%.
- Cash in Treasury bills: −13% after prices, −42% of its share. For 83 months between 2009 and 2015 they paid under 0.25%.
Banks: saved. Stock market: saved. You and your savings account: 0.13%. gg.
wtf does this mean
Red line = your share of the pizza. That’s literally it.
One catch though. The pizza doesn’t only grow because of printing.
From 1971 to 2023, M3 grew 33 times. Over the same years, prices grew 7.6 times, and the real economy grew about 3 times (nominal GDP divided by CPI). More people, more stuff, more trades. All of that needs more money to run.
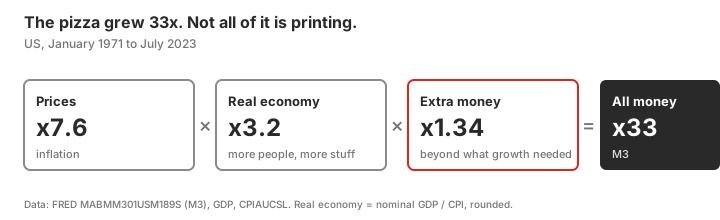
So a flat red line doesn’t mean you stood still. It means you kept up with the whole country growing, plus all the inflation on top.
A falling red line means you actually got eaten.
WTF do you mean money not devoured by just S&P 500?
I assumed the printed money all went into US stocks. So I ran everything else on his site through the same test, over the same window:
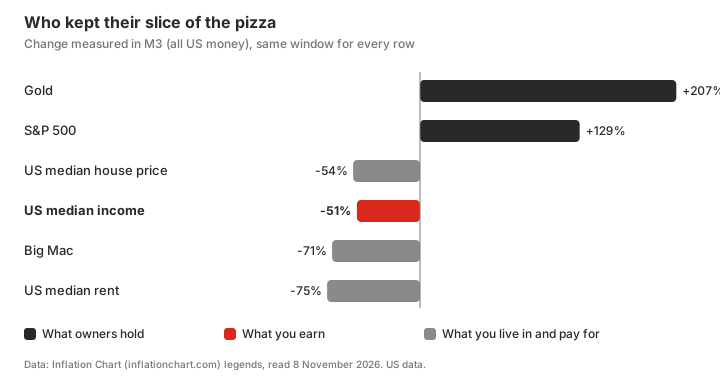
Gold beat stocks. Bitcoin has its own chart and it’s off the scale, but its data only starts around 2010, so it’s not a fair fight.
Read it as two kinds of plate.
The things rich people own: gold and stocks. Their piece grew faster than the pizza.
The thing most of us own: a salary. Your pay grew at half the speed of the pizza. Half.
The median house lost about as much as pay did. So owning your home kept you level with other workers. It didn’t keep you level with shareholders.
Rent and the Big Mac lost even more. That’s the “economy makes more stuff” part of the pizza. A burger was never going to keep up with all the money in America. (It roughly tracks CPI, not the money supply.) Don’t read those two rows as “rent got cheap”. Read the pay row.
So why do the rich eat fatter? Because their plate is stocks and gold, and yours is a paycheck. When the pizza grows, their piece grows with it, and then some. Yours lags.
Sure, plenty of rich people created real value. But who gets how much isn’t decided by value alone. It’s decided at the table, and a worker and a shareholder don’t negotiate as equals. That’s a whole other post. I’ll write it.
WTF should we do?
GET THE FUCK READY FOR WORLD WAR THREE. BUY LOTS OF CANNED FOOD.- Read some Marx. Read some capitalism too. Both sides.
- Be healthy. Ask GPT to build you a diet and workout plan
and prep for SHTF. - Read Epictetus’ Handbook. Practise Stoicism.
Not financial advice.
1982 and 2009 were forced resets. When’s the next one? When the AI bubble pops?
1982 reset because money got too expensive. 2009 reset because everyone had borrowed too much.
And now?
- The S&P 500 measured against all US money is 6% above its 2000 dot-com peak. (FRED’s M3 series stops in November 2023, so after that I use M2, which was almost the same size at that point.)
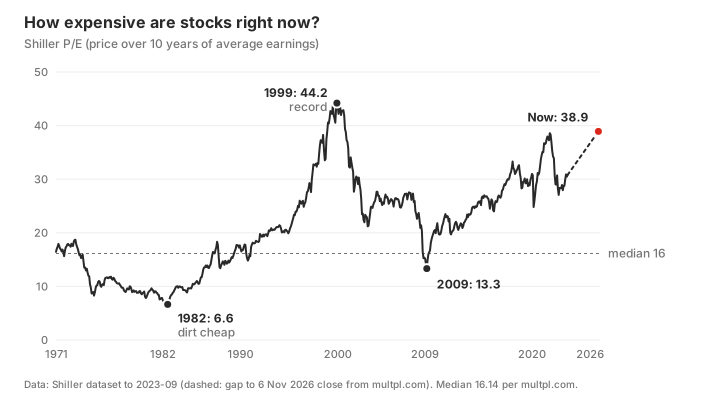
- The Shiller P/E is 38.91. The long-run median is 16. The only time it was higher was December 1999: 44.19.
Confession time.
>be me
>write 3,000 words on how cash gets eaten
>US midterms, 3 November
>AI stocks start looking sus
>panic
>move my entire Australian super out of international shares
>into cash
Yeah I know. But cash gets eaten slow. In 2009 stocks lost 57% in 17 months. I’ll take slow.
Am I scared? Fuck yes. What if it pops? Is it over? Idk man.
When’s the next reset? No idea. Nobody knows. Last time the red line was this high was 2000 though.
Not financial advice. I run a burger website.
Sources: Inflation Chart legends (read 8 November 2026); FRED series MABMM301USM189S (M3), M2SL, WALCL, FEDFUNDS, GS10, GDP, CPIAUCSL, AHETPI, TB3MS, MORTGAGE30US, TERMCBAUTO48NS, UNRATE, MSPUS, CUSR0000SETB01, CSUSHPINSA, DRSFRMACBS, PSAVERT, GASREGW; Robert Shiller’s S&P 500 data; daily S&P 500 closes from Yahoo Finance; Federal Reserve press releases of 25 November 2008 and 16 December 2008; the Fed’s 2006 notice ending M3; Shiller P/E from multpl.com, close of 6 November 2026.