
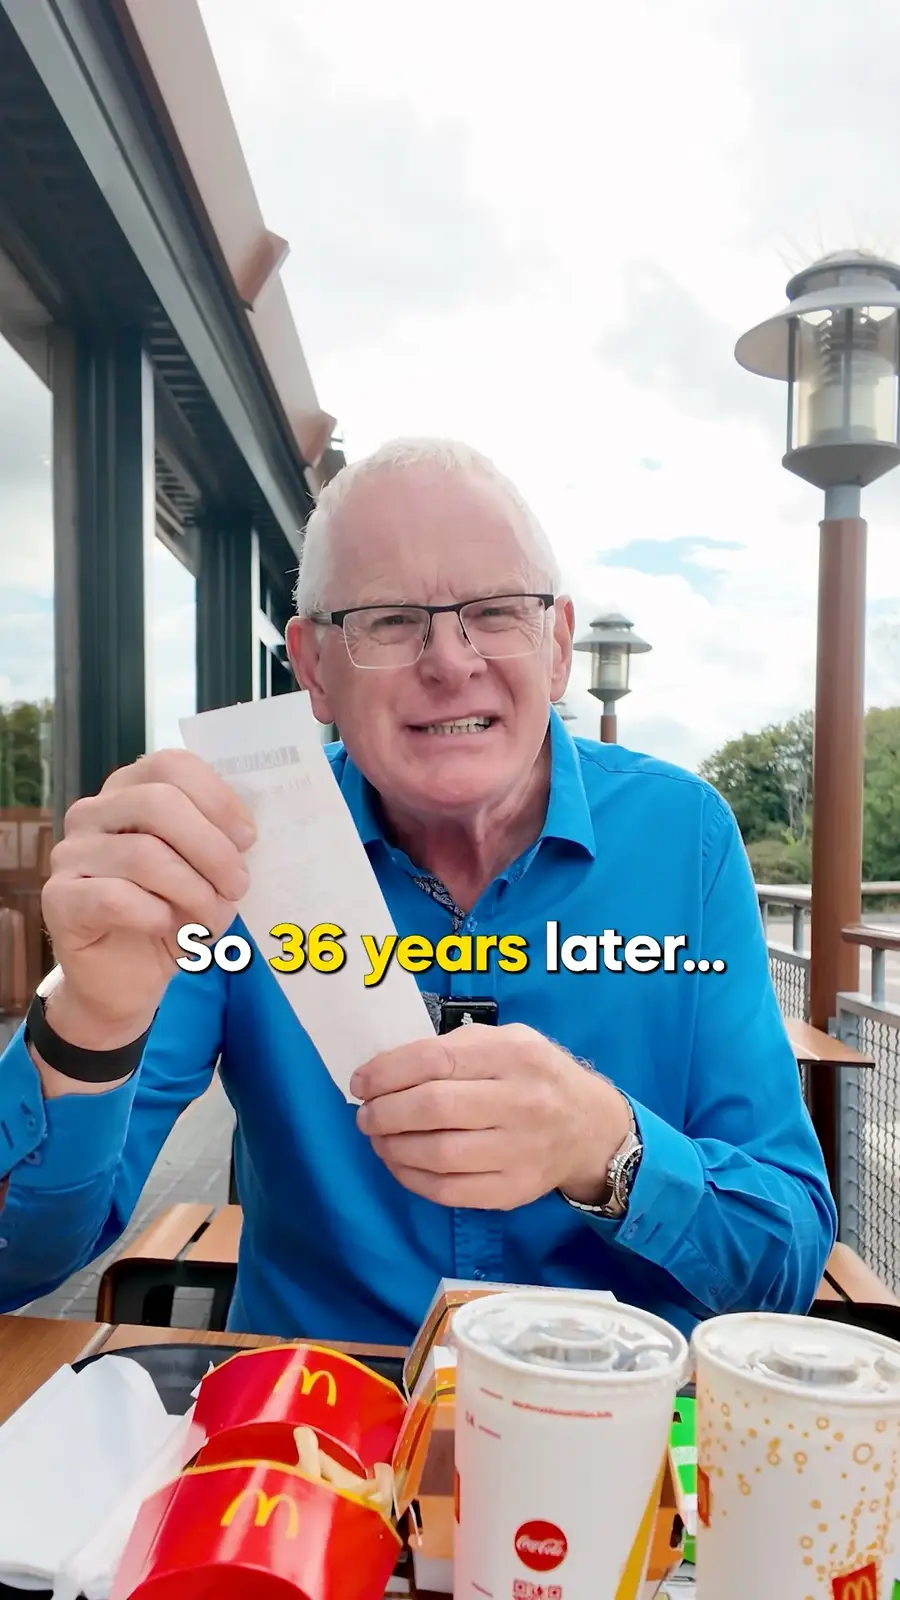
In 1990, Mark Tilbury’s parents paid $8.07 for his McDonald’s order. Thirty-six years later he ordered the exact same thing on camera, paid without looking, and read out the total: $34.60. “330% more expensive.” Since 19 October, more than ten million people have watched him say it.
I run a website that is — give or take — forty years of one sandwich’s price. So when a sandwich video hits ten million views, checking it is more or less my job. I took three of the biggest McDonald’s-price videos on YouTube and ran every number in them against the same Economist data this site runs on — plus the US government’s own figures for prices, wages and money.
Short version — the arithmetic mostly holds up. The conclusions mostly don’t. And the thing that actually broke isn’t on the menu.
The receipt
Verdict The math is right. The question is wrong.
Credit where it’s due first. $8.07 to $34.60 is 4.29 times the price — up 329%. He rounded to 330. Fair.
Now the part he skips. Everything costs more than it did in 1990 — not just burgers. The consumer price index averaged 130.7 that year; in September 2026 it hit 336.9. Push $8.07 through that and you get $20.81 in today’s money. Measured against that, his order is 66% more expensive — not 330%.
Sixty-six per cent is still a lot. It’s just a different video.
The sharper question is how long you’d have to work for it:
| The order | 1990 | 2026 |
|---|---|---|
| Price | $8.07 | $34.60 |
| Average hourly pay, production and nonsupervisory workers | $10.20 | $32.60 |
| Work time at that pay | 47 min | 64 min |
| Federal minimum wage | $3.80 | $7.25 |
| Work time at the minimum | 2.1 hours | 4.8 hours |
An average worker now puts in 17 more minutes for this order than in 1990. Someone on the federal minimum puts in more than twice the time — nearly five hours of work for two burgers, two fries, two Cokes and two pies.
What I can’t check is the $8.07 itself. There’s no receipt on screen, no store named — and The Economist’s public data has no US Big Mac price between 1987 and 1999. The $34.60 may or may not include sales tax — the video doesn’t say. I’m taking both numbers on trust.
The decade that doubled
The most repeated number in McDonald’s-price videos is 100%. I found six that say it, with 9.5 million views between them:
- The Food Theorists, July 2024: “some reports that claim they’ve even increased their prices by over 100% in the last decade” (0:46). 1.6 million views.
- How Money Works, May 2025: “the average McDonald’s menu item is now twice as expensive as it was 10 years ago” (4:29). 2.7 million.
- Patrick Cc, September 2025: “raised their prices by 55 to 100% between 2014 and 2024” (12:59). 2.3 million.
- Michael Girdley, July 2026: “Study over a full decade shows that McDonald’s prices basically doubled” (11:42). 1.4 million.
- Damon Cassidy, July 2026: “raising menu prices by more than 100% over the last decade” (10:51). 0.8 million.
- JunkBondInvestor, August 2026: “McDonald’s prices had risen 100%” (4:05). 0.6 million.
How Money Works names its source — a 2024 study by FinanceBuzz. Most of the others just say “a study” — or nothing at all.
There’s a Chinese idiom for this: 三人成虎, “three men make a tiger.” Hear from three different people that a tiger is loose in the market, and you’ll believe it — whether or not anyone saw a tiger.
So did McDonald’s double its prices in ten years? Not the Big Mac. The Economist has the US Big Mac at $4.29 in July 2014 and $5.69 in July 2024 — up 32.6%. Consumer prices over the same ten years: up 32.0%.
Verdict The number is right. The label is wrong.
Food Theorists actually got there on their own. At 4:50 they say the Big Mac rose 32% since 2014, “from an average of $3.99 in 2014 to $5.29 now” — a different starting price from ours, the same rise. Nine seconds later: “the Big Mac hasn’t kept up with inflation.” It did. Prices overall rose about 32% that decade, and the Big Mac rose 32.6%. That isn’t falling behind. That’s keeping pace to the decimal point.
McDonald’s said much the same in May 2024 — answering a version of the rumour in which the Big Mac had doubled since 2019. Its US president, Joe Erlinger, wrote: “The average price of a Big Mac in the U.S. was $4.39 in 2019 … the average cost is now $5.29. That’s an increase of 21% (not 100%).” Yes, that’s the company marking its own homework. Our data comes from somewhere else entirely — and puts 2019 to 2024 at +20.8%.
So where does 100% come from? I haven’t seen FinanceBuzz’s item list — so I can’t tell you which items carried that average. Two things I can tell you. Fast food as a whole really did outrun inflation that decade — the government’s index for limited-service meals rose 53.5%, against 32.0% for everything. And anything that used to cost a dollar doubles the day it costs two. The Big Mac just isn’t that item.
These videos also sent me back to my own piece from last week, where I wrote that the Big Mac outran inflation and “almost all of that gap opened after 2009.” Zoom in and it gets sharper — the gap opened in five years. July to July:
| Big Mac | All prices | Fast food | |
|---|---|---|---|
| 2009 → 2014 | +25.1% | +10.6% | +11.0% |
| 2014 → 2024 | +32.6% | +32.0% | +53.5% |
| 2024 → 2026 | +9.3% | +6.2% | +6.7% |
| 2009 → 2026 | +81.3% | +55.1% | +81.9% |
The Big Mac’s real run was 2009 to 2014 — five years in which it beat prices by more than two to one. Then it spent ten years moving in lockstep with everything else. Everybody’s angry about the one decade the burger behaved.
The money printer
Verdict The wage fact is right. The money-supply claim is wrong.
Front Page’s video runs 41 minutes — and it’s the most serious of the three. A lot of it holds up. At 16:45 it says the federal minimum wage has been stuck at $7.25 since July 2009 — “the longest the national minimum wage has ever gone without a raise in American history.” True: more than seventeen years now, against a previous record of under ten (September 1997 to July 2007). At 29:20 it even quotes McDonald’s own 21% against the viral 100%. Also true.
Then, at 22:49:
“Over the past 15 years or so, the price of a Big Mac has tracked the growth of the money supply far more closely than it has tracked the government’s official inflation numbers. The burger has been quietly telling you how much money got printed long before the official figures would admit it.”
That one I can test. It doesn’t hold. Take the $3.64 Big Mac of July 2011 and push it forward three ways:
| July 2011 → July 2026 | Rise | Big Mac would cost |
|---|---|---|
| Money supply (M2) | +148.0% | $9.03 |
| Consumer prices (CPI) | +47.8% | $5.38 |
| The actual Big Mac | +70.9% | $6.22 |
The burger did run ahead of CPI — but it sits 84 cents from the CPI line and $2.81 from the money line. The cleanest test is the stretch with the most printing. M2 grew faster in 2020 and 2021 than at any point since the Fed’s series begins in 1959. From January 2020 to July 2026, M2 rose 50.3%, CPI 29.4% — and the Big Mac 29.0%. Had the burger simply tracked CPI from January 2020, it would cost $6.24 today. It costs $6.22.
What actually broke
All three videos ask the same question: why did the burger get so expensive? Wrong suspect. Here’s the same Big Mac priced in minutes of work:
| One Big Mac | July 2009 | July 2026 |
|---|---|---|
| Price | $3.43 | $6.22 |
| Work time, average production and nonsupervisory pay | 11.1 min | 11.5 min |
| Work time, federal minimum wage | 28.4 min | 51.5 min |
For the average worker, a Big Mac costs the same eleven-and-a-bit minutes it did in 2009 — 24 seconds more, to be exact. For someone on the federal minimum, it costs 23 minutes more. The burger moved with everything else. The floor didn’t move at all.
My own receipts say the same thing from the other side of the world. Last week I listed what has gone up in my eleven years in Australia — lactose-free milk from about $1 to $2, a rice bowl from $10 to $19 or $20, a Big Mac from A$5.30 to A$8.50. The Big Mac was the smallest jump on the list.
Front Page got one thing exactly right, though. The burger has been quietly telling you something for fifteen years. It just isn’t how much money got printed.
It’s how long $7.25 has stood still.
Want the long version, every year back to 1986? That’s Shitty Inflation. Want today’s Big Mac price where you live? The Big Mac Index calculator has every country in the current edition.
Sources: Big Mac prices from The Economist’s public dataset, the same file this site runs on. Prices, wages and money from the Bureau of Labor Statistics and the Federal Reserve via FRED: CPI-U, average hourly earnings of production and nonsupervisory employees, the federal minimum wage and M2. Fast food is the BLS index for limited service meals and snacks. 1990 figures are annual averages, except the federal minimum: $3.80 from April 1990, $3.35 before that (which would make it 2.4 hours). View counts as of 31 October 2026.