In September 1986 a Big Mac in the United States cost $1.60. In July 2026 it costs $6.22.
Everybody already knows that number went up. That is not the interesting part. The interesting part is this: if the burger had only kept pace with official inflation, it would cost $4.85 today. It costs $6.22. And if you earn the federal minimum wage, the burger that used to cost you 29 minutes of work now costs you 51.
So no, it is not just “inflation”. It is inflation, plus a burger that outran inflation, plus a wage floor that stopped moving seventeen years ago. Three things at once. Here are the receipts.
The numbers, side by side
| Sept 1986 | July 2026 | Multiplier | |
|---|---|---|---|
| US Big Mac price | $1.60 | $6.22 | ×3.89 |
| Consumer prices (CPI-U) | 110.2 | 333.9 | ×3.03 |
| Average hourly pay, production & nonsupervisory workers | $8.94 | $32.42 | ×3.63 |
| Federal minimum wage | $3.35 | $7.25 | ×2.16 |
The Big Mac prices are from The Economist: the 1986 figure is from the very first Big Mac index (6 September 1986, archived here), and 2000 onward is from The Economist’s public dataset, the same file this site runs on. Prices and wages are from the Bureau of Labor Statistics via FRED: CPI-U, average hourly earnings of production and nonsupervisory employees, and the federal minimum wage.
Read the multiplier column top to bottom. The burger is at the top. The minimum wage is at the bottom. Everything you feel at the counter lives in the gap between those two rows.
The burger tracked inflation for twenty years. Then it didn’t.
Take $1.60 in 1986 and push it forward with CPI alone. That gives you a “fair” inflation-only price for every year since.
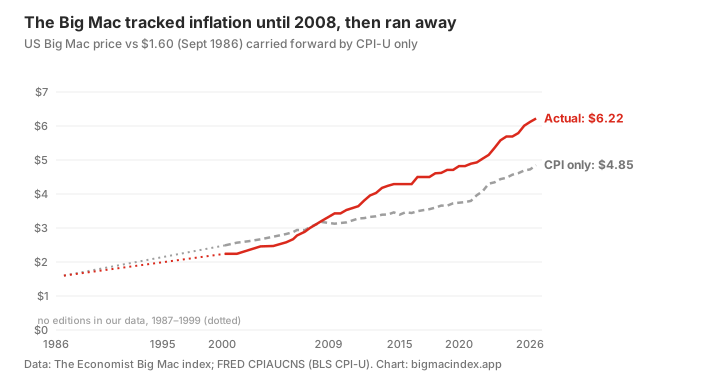
This is the part I did not expect. For two decades the Big Mac was a well-behaved citizen. In April 2000 it cost $2.24 when the CPI-only line said $2.49. In June 2008 it was $3.21 against $3.18. Basically on the line.
Then from July 2009 to July 2026:
- the Big Mac went from $3.43 to $6.22, up 81%
- consumer prices went up 55%
The burger did not get bigger. It got pricier, faster than the basket of everything else. Twenty-eight per cent above where inflation alone would have put it, and almost all of that gap opened after 2009.
Why 2009 matters twice
July 2009 is also the last time the US federal minimum wage changed. It went to $7.25 on 24 July 2009 and has sat there ever since (the Department of Labor’s own history table still ends at that row).
$7.25 in July 2009 had the buying power of $11.24 in today’s money. Today it is still $7.25. That is a 35% pay cut, delivered without anyone ever having to vote for a pay cut.
So in the same month, two lines that used to move together split apart. The burger started running ahead of inflation. The wage floor stopped moving at all.
Minutes of work for one Big Mac
This is the chart that made me angry enough to write this post.
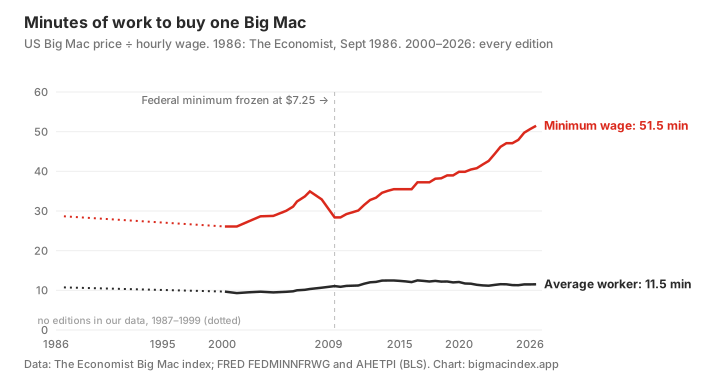
| Year | Big Mac | Federal minimum | Minutes of minimum-wage work | Minutes for the average worker |
|---|---|---|---|---|
| 1986 | $1.60 | $3.35 | 28.7 | 10.7 |
| 2000 | $2.24 | $5.15 | 26.1 | 9.7 |
| 2009 | $3.43 | $7.25 | 28.4 | 11.1 |
| 2015 | $4.29 | $7.25 | 35.5 | 12.2 |
| 2020 | $4.82 | $7.25 | 39.9 | 12.1 |
| 2026 | $6.22 | $7.25 | 51.5 | 11.5 |
Put it another way. In 1986, one hour at the federal minimum bought you 2.09 Big Macs. In 2009, still 2.11. Today, 1.17. Almost half a burger per hour gone, and every bit of that loss happened after 2009.
”But nobody actually earns $7.25”
Fair. Plenty of states and cities have set their own, higher minimum wages, and if you live in one of them your line on that chart is lower than mine. The federal number is still the legal floor wherever no local law sits above it, and it is the only nationwide wage floor there is. It is the cleanest way to ask: what has the bottom of the American wage ladder been allowed to buy?
The average worker did better, and that matters. Production and nonsupervisory pay went up 3.63 times since 1986, which beats CPI’s 3.03 by about 20%. That is a real raise.
It is still not enough to keep up with the burger. A Big Mac cost the average worker 10.7 minutes of pay in 1986 and 11.5 minutes now. An hour of that pay bought 5.59 Big Macs then and 5.21 now. Smaller loss, same direction.
That is the honest version of the headline. Wages did grow. They just did not grow as fast as this sandwich, and at the bottom they did not grow at all.
It is not just America. Here is my own receipt.
I have lived in Australia since 2015, so let me put my own numbers next to the American ones.
I am lactose intolerant. Lactose-free milk is not a lifestyle choice for me, it is the milk. When I arrived, a carton cost about $1. Now it is about $2. That is not “prices went up a bit”. That is one of my most basic costs doubling.
Eating out is worse. Back then, $10 got you a rice bowl at a casual restaurant. Today I pay $19 or $20 for the same kind of meal, and I am not always full afterwards.
The Big Mac agrees with me. This site’s own Australian data has it at A$5.30 in July 2015 and A$8.50 in July 2026, up 60% in eleven years. You can see the full series on the Australia page.
Then I went to the official numbers. The Australian Bureau of Statistics publishes a price index for each slice of the Consumer Price Index. Here is the September quarter 2015 against the June quarter 2026, the latest one out:
| Australia, ABS CPI (weighted average of eight capital cities) | Change, Sep 2015 → Jun 2026 |
|---|---|
| All groups CPI (the “official inflation” number) | +36% |
| Milk | +47% |
| Electricity | +48% |
| Education | +49% |
| Tertiary education | +43% |
| Property rates and charges (council fees) | +47% |
| Take away and fast foods | +42% |
| Restaurant meals | +36% |
| Telecommunication equipment and services | −19% |
| Audio, visual and computing equipment | −31% |
Source: ABS, Consumer Price Index, index numbers by expenditure class, pulled from the ABS Data API on 24 October 2026.
Two things jump out.
First, my receipts are worse than the official averages. The ABS says milk is up 47%; my lactose-free carton is up 100%. The ABS says restaurant meals are up 36%; my rice bowl is up about 90%. I am not claiming the ABS is wrong. An index averages across every brand, every shop and every city, and that is exactly the point of this whole post: you do not buy the average. You buy your milk, at your shop, and if your basket is mostly food, rent and fees, your inflation is higher than the headline.
Second, the electronics. Audio, visual and computing equipment is 31% cheaper than when I arrived, while the overall price level is 36% higher. The things that are actually hard to make, decades of engineering packed into something you hold in one hand, got cheaper. Milk, a bowl of rice, a council rates notice and a semester of university did not. Pretty much everything with a person, a lease or a regulator behind it went up faster than the average.
(Except RAM and graphics cards, of course. Those are now priced for AI data centres, not for you.)
What did a Big Mac cost in 1980?
People search this a lot, and the honest answer is: nobody has a reliable national figure.
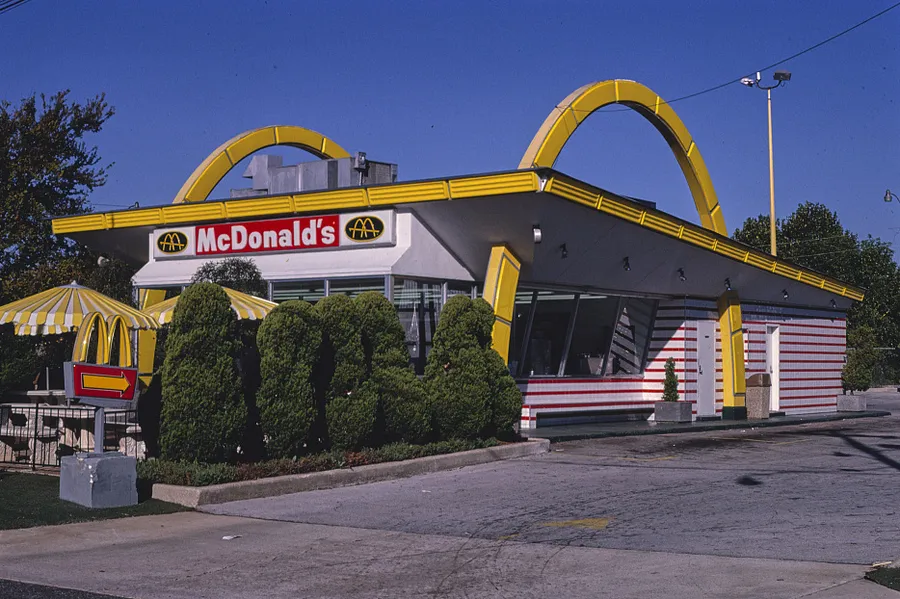

The Economist’s index starts in 1986, so there is no index price before that. The number you will find most often for 1980 is “around $1.20”, and as far as I can trace it the best anchor is a single store: footage from a McDonald’s in Brighton, Massachusetts in October 1980, from the GBH archive, showing $1.20 on the menu board (as cited by Snopes). One store, one city. Other numbers floating around ($1.00, $1.10, $1.60 to $1.90) I could not trace to any primary source at all, so I am not using them.
For the record, the Big Mac launched in 1967 in Uniontown, Pennsylvania at 45 cents and went national in 1968 (UPI, 1993).
Two caveats so nobody yells at me on Reddit
One: the Economist’s US price is not your local menu. The index uses a single US benchmark price, and US Big Mac prices vary a lot by state. In 1993, for example, McDonald’s itself told UPI the national average was $1.65 while big-city restaurants charged more than $2. So treat the dollar figures as a consistent series, not as what your nearest drive-thru charges. The trend is the point, and it uses the same source the whole way through. The current US figure and how it compares with every other country is on the United States page.
Two: 1987 to 1999 is a gap in this data. The Economist did publish those years, but they are not in its public dataset, so the charts draw that stretch as a dotted line rather than invent points.
So what is the Big Mac actually telling you?
Official inflation is an average over everything. Your life is not an average over everything. The BLS index for food away from home, the stuff you actually buy on a Tuesday, is up 3.50 times since September 1986 against 3.03 for the headline CPI. Since July 2009 it is up 78% against 55%. The Big Mac, up 81% over the same stretch, sits right on top of it. It is the cleanest single receipt we have for that gap: same sandwich, same company, forty years of prices.
And a receipt only means something next to a paycheck. At the top of the wage scale, the Big Mac is a rounding error. At the federal floor, it went from half an hour of work to almost a full hour, and the floor has not moved since Barack Obama’s first summer in office.
That is why this feels worse than the CPI says it is. Because for the people at the bottom, it is.
Update, 31 October 2026. I fact-checked three viral McDonald’s-price videos against this same data, and took a closer look at the 2009 gap while I was at it. Most of it opened in five years: from July 2009 to July 2014 the Big Mac rose 25.1% while consumer prices rose 10.6%. From 2014 to 2024 the two moved almost exactly together, 32.6% against 32.0%. The full breakdown, with the videos: McDonald’s Is 330% More Expensive? I Fact-Checked the Viral Videos.
Header photo: gas prices in Eugene, Oregon, 5 June 2022, by Rick Obst, CC BY 2.0, via Wikimedia Commons; cropped.

Want to see what a Big Mac costs where you are, and what that says about your currency? The Big Mac Index converter has every country in the current edition, with live exchange rates.