A reader recently asked a reasonable question: where on this site is the Big Mac index adjusted for income per person? Norway and Switzerland have expensive burgers because they are rich, so surely the adjusted index gives them some credit for that.
The honest answer was that the site described the adjustment but never showed the numbers. That is now fixed: the adjusted figures are in the dataset download. The more interesting answer is that the adjustment gives Norway and Switzerland no credit at all. It makes them look slightly more overvalued. Here is why.
What the adjustment is
The raw Big Mac index compares a burger’s dollar price with the US price. A Big Mac costs $9.04 in Switzerland and $6.22 in the United States, so the franc looks 45% overvalued.
The GDP-adjusted index, which The Economist added in 2011 (“Beefed-up burgernomics”), asks a different question: given how rich a country is, is its burger dearer or cheaper than you would expect? Richer countries have higher wages in non-traded services, so their price levels “should” be higher. That is the Balassa–Samuelson effect (Balassa 1964; Samuelson 1964), and a cross-country regression of price levels on income per head is a standard way to put a number on currency misalignment: Frankel (2006) used one to estimate that the renminbi was about 35% undervalued in 2000. The Big Mac version swaps a national price level for one sandwich.
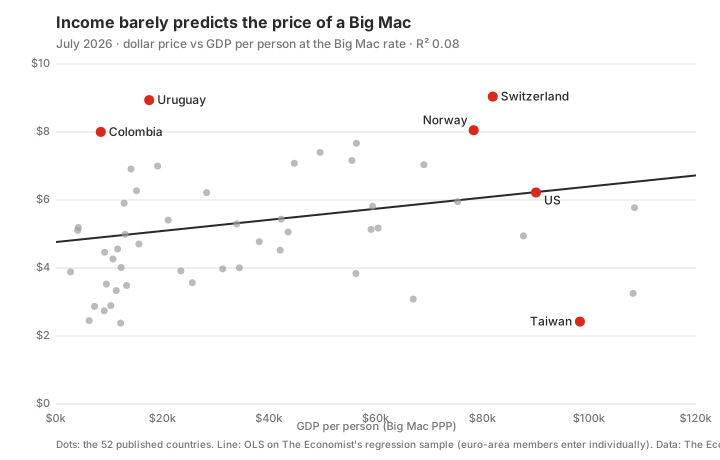
Mechanically, The Economist fits a straight line through the dollar price of a Big Mac against GDP per person, separately for each edition, and reads each country’s position relative to that line. A burger above the line means a currency that is overvalued relative to what its income predicts; below it, undervalued. The published number is that deviation relative to the United States.
The twist: which “GDP per person”?
Since July 2022 the income measure on the horizontal axis has not been GDP per person at market exchange rates, nor the IMF’s purchasing-power-parity figure. It is GDP per person in local currency converted into dollars at the Big Mac exchange rate itself: local GDP divided by the ratio of the local burger price to the US burger price. The method is spelled out in The Economist’s code, which is open on GitHub, and the whole history has been recomputed with it.
That choice has a consequence. A country with an expensive burger gets its income deflated by exactly the thing being measured. In the July 2026 edition:
| GDP per person | Market rates | Big Mac rate (used) |
|---|---|---|
| United States | $89,991 | $89,991 |
| Norway | $94,468 | $78,314 |
| Switzerland | $115,620 | $81,901 |
| Taiwan | $39,489 | $98,223 |
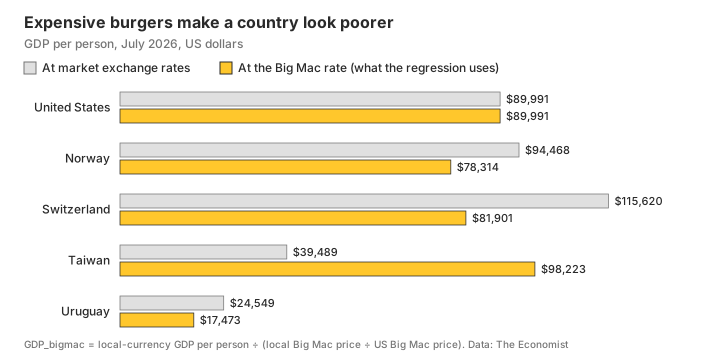
At market rates Norway and Switzerland are richer than the United States. In the regression they are poorer, so the line predicts their burgers should be cheaper than America’s. They are much dearer, so after adjustment the krone goes from 29% to 34% overvalued and the franc from 45% to 49%. Taiwan, whose burger is one of the cheapest in the survey, comes out richer than the United States on this measure, and its dollar looks 62% undervalued either way.
Who flips
Seven countries move from undervalued on the raw index to overvalued on the adjusted one, and six of them are in the Americas:
| Country | Raw index | GDP-adjusted |
|---|---|---|
| Peru | −20% | +1% |
| Canada | −7% | +2% |
| Nicaragua | −18% | +6% |
| Chile | −13% | +6% |
| Honduras | −17% | +8% |
| Argentina | −5% | +19% |
| Poland | 0% | +19% |
None moves the other way. The most overvalued currencies after adjustment are not the Swiss franc or the Norwegian krone but the Uruguayan peso (+77%) and the Colombian peso (+64%): $8–9 burgers in countries whose GDP per person, on this measure, is about $17,000 and $8,000.
A line that explains less every year
The adjustment only makes sense if income actually predicts burger prices. We refitted The Economist’s regression for all 45 editions since 2000, on their own sample (about 70 observations in recent editions, because the euro-area members enter individually), and looked at the R². Our fitted prices match their published ones to within 10−14, so this is their line, not an approximation of it.
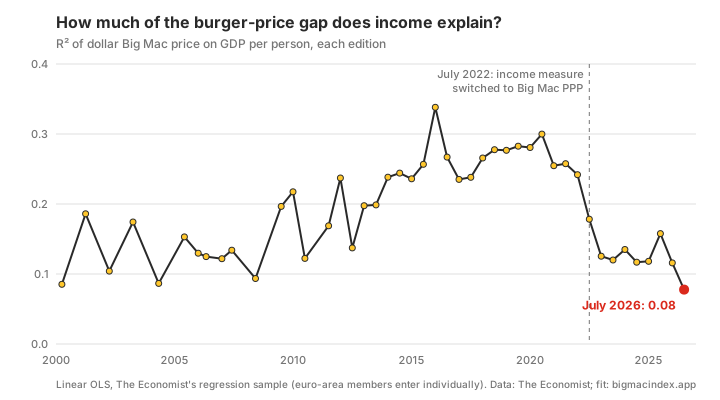
From 2014 to early 2022 the fit explained 24–34% of the variation in dollar burger prices. From mid-2022 it has explained 12–18%. In July 2026 it explains 8%, the weakest of any edition.
We are not going to claim a cause. Two candidates are the post-pandemic inflation that scrambled the relationship between prices and incomes, and the Big Mac PPP conversion described above, which builds a mechanical negative component into the relationship it is trying to measure. The whole series was recomputed with the same method, and the 2021 expansion of the sample (from 49 to 71 observations) only took the R² from 0.30 to 0.25, so the later fall is not just a change in who is in the sample. Either way, the GDP-adjusted figure for a given country now rests on a line that most countries are nowhere near.
Whether the deviations from that line close over time is the question a panel like this is actually good for. Frankel (2006) found that cross-country Balassa–Samuelson gaps close by about half over the following decade; Frankel and Rose (1996), in a panel of 150 countries, found that deviations from PPP itself erode at roughly 15% a year, a half-life of about four years. Forty-five editions of burger prices are a small but tidy dataset for checking whether either still holds.
What to use it for
Neither index is the “correct” one. The raw index answers “what exchange rate would make a Big Mac cost the same everywhere?”. The adjusted index answers “is this burger dear or cheap for a country at this income?”, with the caveat that “income” here is itself burger-deflated. For rich, expensive countries the two indices now agree; for middle-income countries with pricey burgers they disagree sharply.
The live case this year is Asia. The US Treasury’s July 2026 currency report keeps ten economies on its monitoring list, seven of them in Asia, and whether the yuan, yen and won are undervalued has been argued over all summer. Frankel (2026) argues that intervention is unlikely to change much, because the weak currencies are a symptom of saving and interest-rate fundamentals (high saving in China, very low rates in Japan, low saving in the United States) rather than a lever of their own. The burger data agree on the direction whichever way you cut them: on the raw index the yuan, yen and won are 37%, 50% and 38% undervalued; after adjusting for income, 24%, 47% and 32%. The adjustment moves the yuan a lot and the yen almost not at all, because Japan is rich and its burger is cheap.
Get the numbers
Both series, for every edition since April 2000, are in the dataset download:
big-mac-gdp-adjusted-latest.csv: July 2026, raw and adjusted side by side, with both income measures (GDP_dollarat market rates,GDP_bigmacat the Big Mac rate).big-mac-gdp-regression-by-edition.csv: observations, intercept, slope and R² for each of the 45 editions.bigmac_gdp_regression.py: the script that produces them from The Economist’s source data, and checks the fit against their published prices.
The data are The Economist’s, from their open repository (MIT licence); the fitting is ours and is easy to check. This site is an independent project, not affiliated with The Economist.
References
- Balassa, B. (1964). The purchasing-power parity doctrine: a reappraisal. Journal of Political Economy, 72(6), 584–596.
- Frankel, J. A. (2006). On the yuan: the choice between adjustment under a fixed exchange rate and adjustment under a flexible rate. CESifo Economic Studies, 52(2), 246–275. Working-paper version: “On the renminbi”, NBER Working Paper 11274 (2005).
- Frankel, J. A. (2026). Undervaluation of Asian currencies. Guest contribution, Econbrowser, 17 August 2026 (also distributed by Project Syndicate).
- Frankel, J. A., & Rose, A. K. (1996). A panel project on purchasing power parity: mean reversion within and between countries. Journal of International Economics, 40(1–2), 209–224.
- Samuelson, P. A. (1964). Theoretical notes on trade problems. Review of Economics and Statistics, 46(2), 145–154.
- The Economist (2011). Beefed-up burgernomics. 30 July 2011.
- The Economist. The Big Mac index: data and methodology. github.com/TheEconomist/big-mac-data (README and
data-generator-v3.R, commit0d97104).